Master’s Thesis: Co-designing an employee MyData service
February to July 2020

Personal data privacy is a crucial and timely issue as we are living in a post-GDPR world where individuals have rights over their data. Due to this multiple companies have adapted data portability to allow users to see their own data and control how its used. The MyData Global initiative has been working tirelessly for years to encourage and promote this way of working when it comes to companies using personal data of customers. However what has largely been ignored is the employment context. Given the rise of big data and AI – new ways to gather data are becoming increasingly common place but these cannot be adopted without a regard to privacy. Especially in the work place, this conversation is important as the future of work is increasingly based on digital analytics and learning about what knowledge a company has, how can that knowledge be search-able, how can companies predict their future better or how can they know what topics of discussion are emerging within the organisation.
The Challenge:
To find the best approach to creating transparency and providing data rights to employees in the context of a Finnish technology consultancy.
How do you design to develop trust that can help empower through data use?
This was further divided into three focused design questions to tackle through the methods used:
- How might we use transparency for employee data to create informed, data decision-makers?
- How might we provide control over their data to employees?
- How might we build an understanding of the value of data usage through the transparency?
Learning from literature:
The thesis includes a thorough literature review that is looking at the various components of topics that make up this discussion. It tries to gather understanding from the legal perspective of the GDPR law and Article 8 of the European Convention on Human Rights. It then looks at how employee data can be used and how trust is important for organisations looking to use data to grow their future business. Then we looked further into how digital tools can build that trust – specifically how transparency-enhancing tools are important to understand what we need to build. We also looked at informed consent and how HCI needs to enable better understanding of data – also deep diving into the usability aspects of privacy policies as a use case. We will also focus on privacy by design literature and how a collaborative design methodology can be included in designing the aforementioned service.
From the information gathered in the literature review, the main research questions of this thesis are about how might we design trust, specifically how can we measure and enhance transparency and control for employees in a technology consultancy and explain the value of data through a digital service.
")
How much influence people think they have at this stage
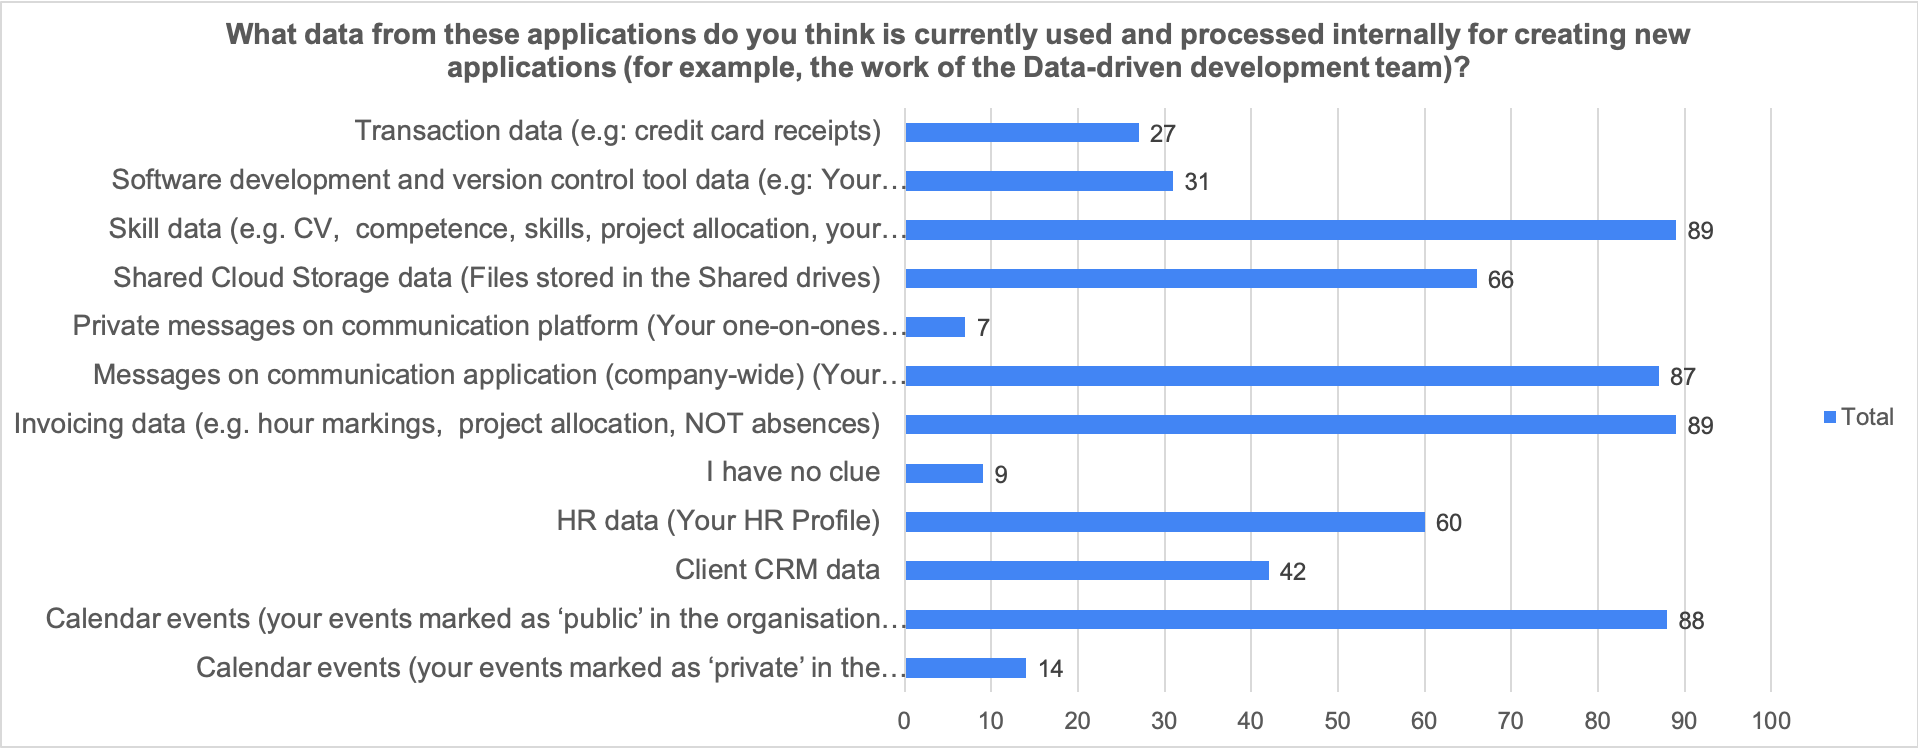
What data is used in applications according to employees
Phase I: User Research
Phase II: Workshops
- the data sources presented,
- the applications that are showcased,
- setting up consent for data usage in an application.
Additionally, to guide and embed privacy by design, a workshop was also conducted with teams developing data-driven applications. These were targeted to help them address privacy in their work and create a transparent canvas where data-decisions could be documented easily. This workshop would test out the data sensitivity mapping framework designed by me to help these teams arrive at sensitivity recommendations that can be used to handle the data they use in the applications.
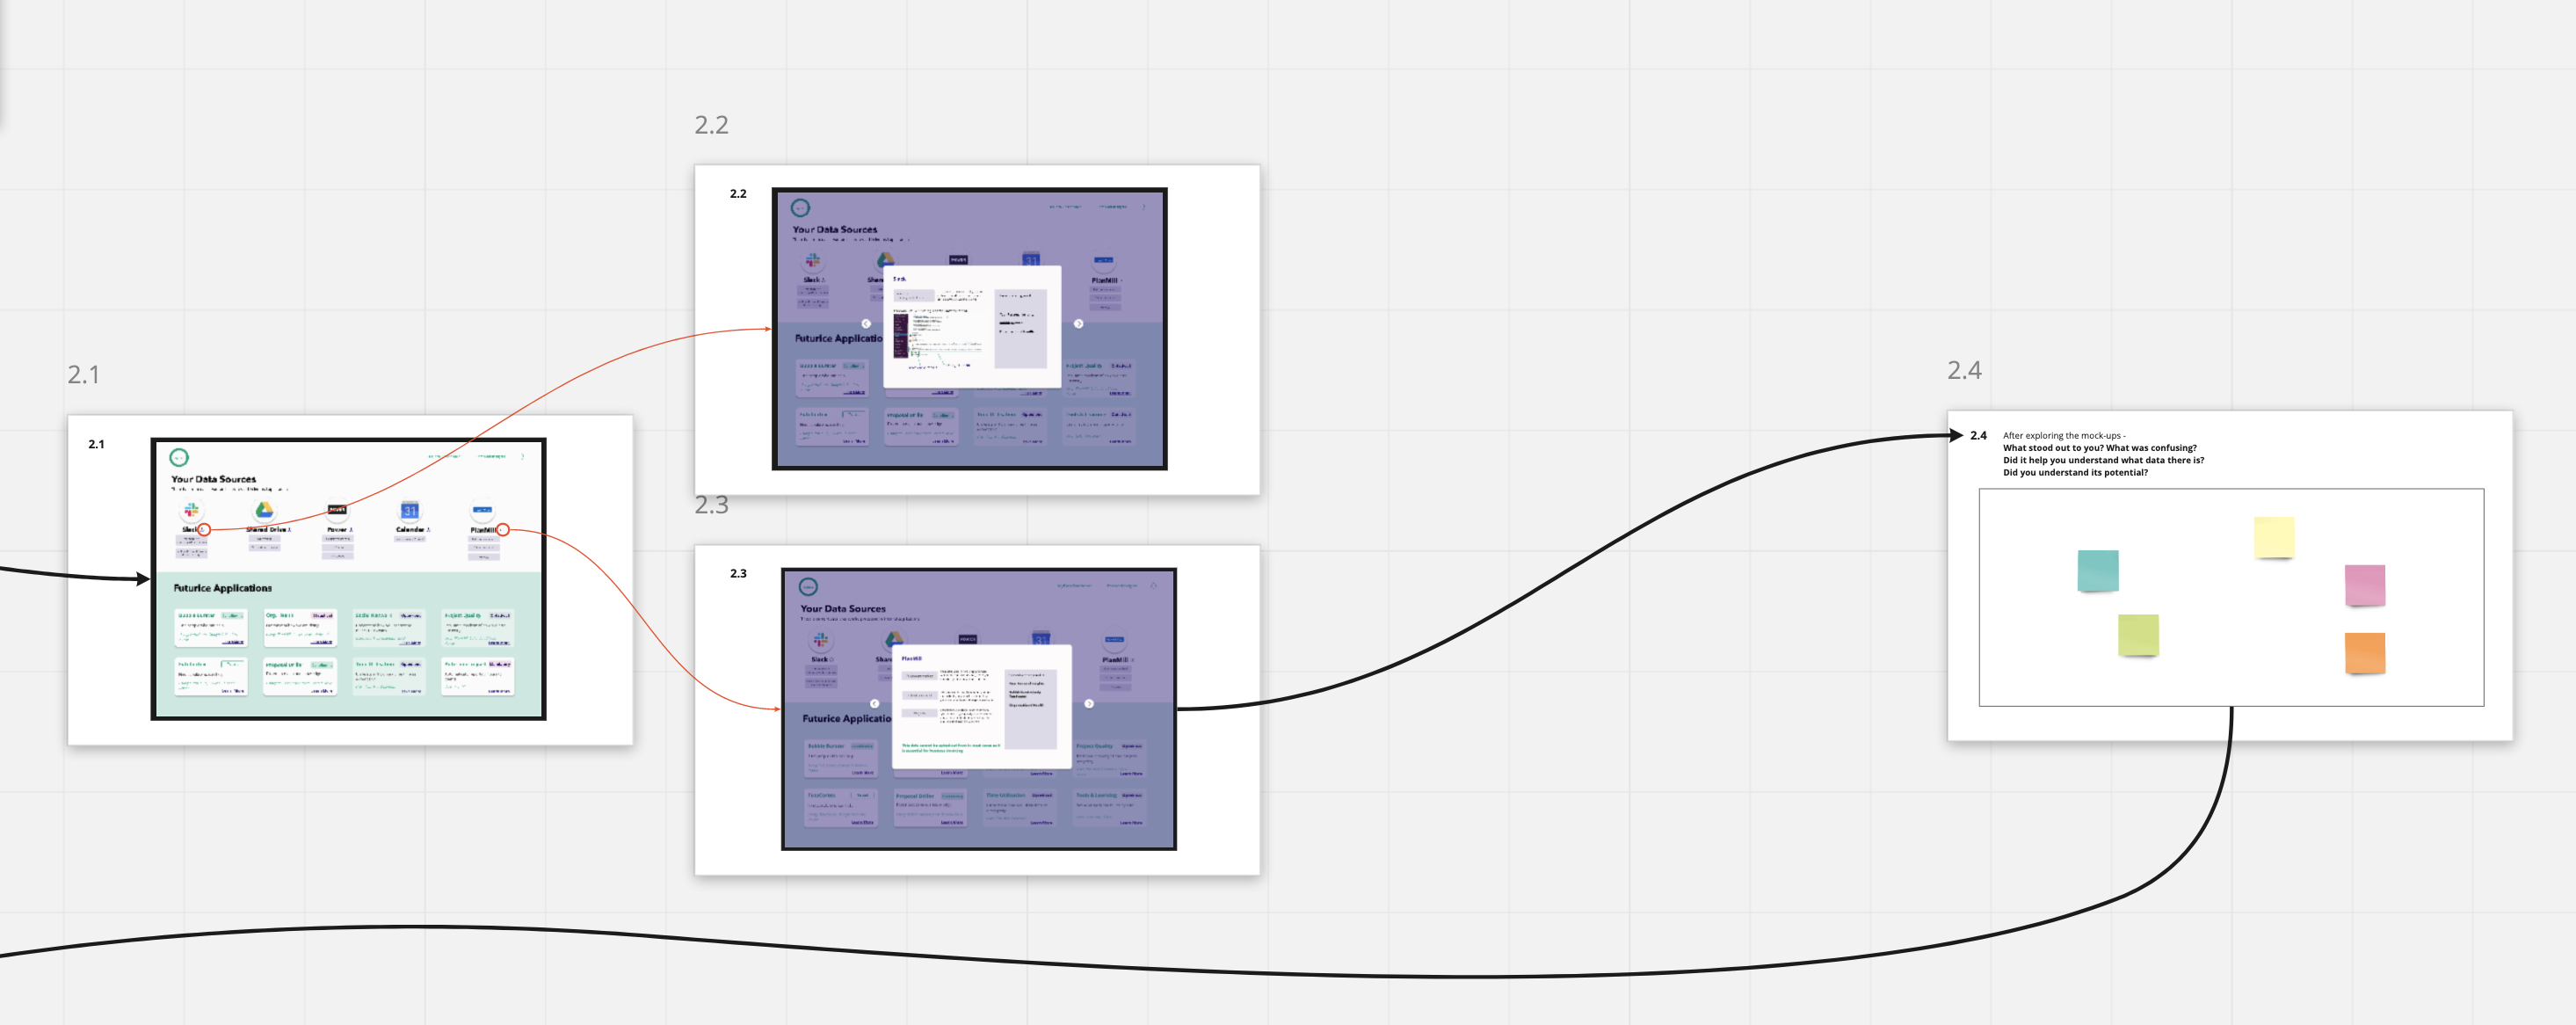
Workshop run live in Miro showing mock-ups
")
Workshop run live in Miro showing mock-ups
")
An example sensitivity recommendation
The data categories for company data ideated as a result of workshops
Phase III: Prototype Testing


How much influence employees felt they had after testing this prototype
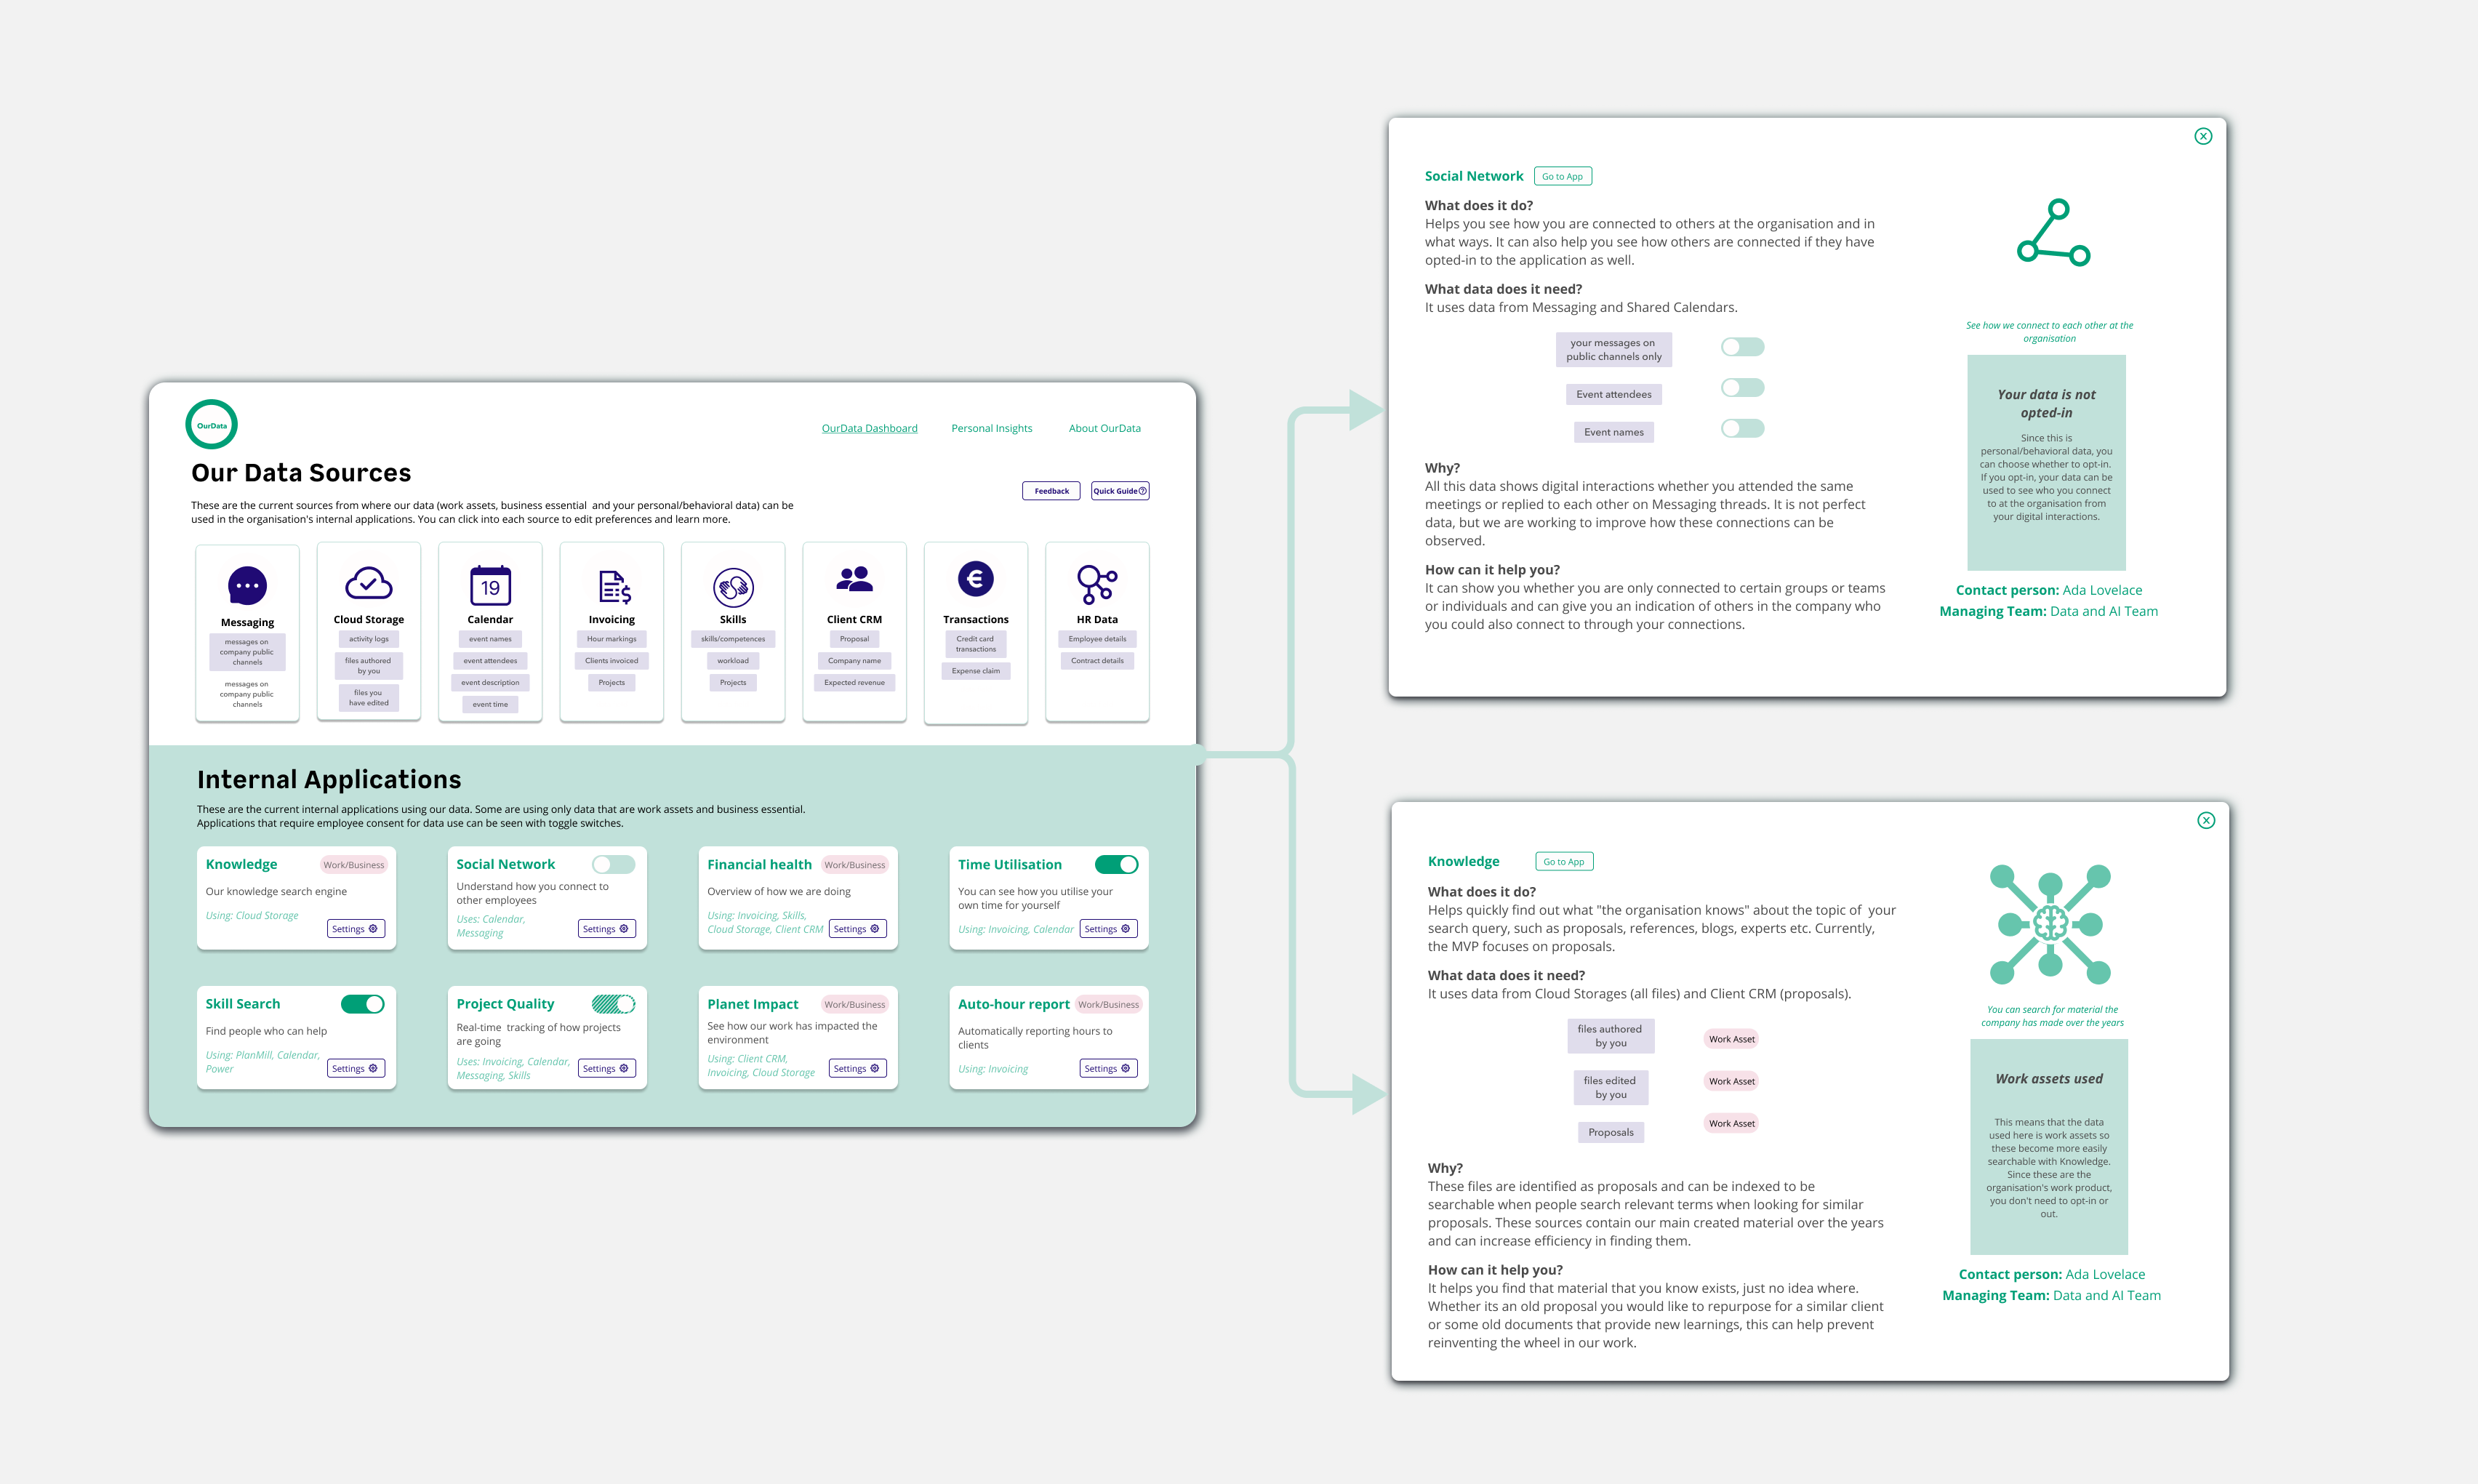
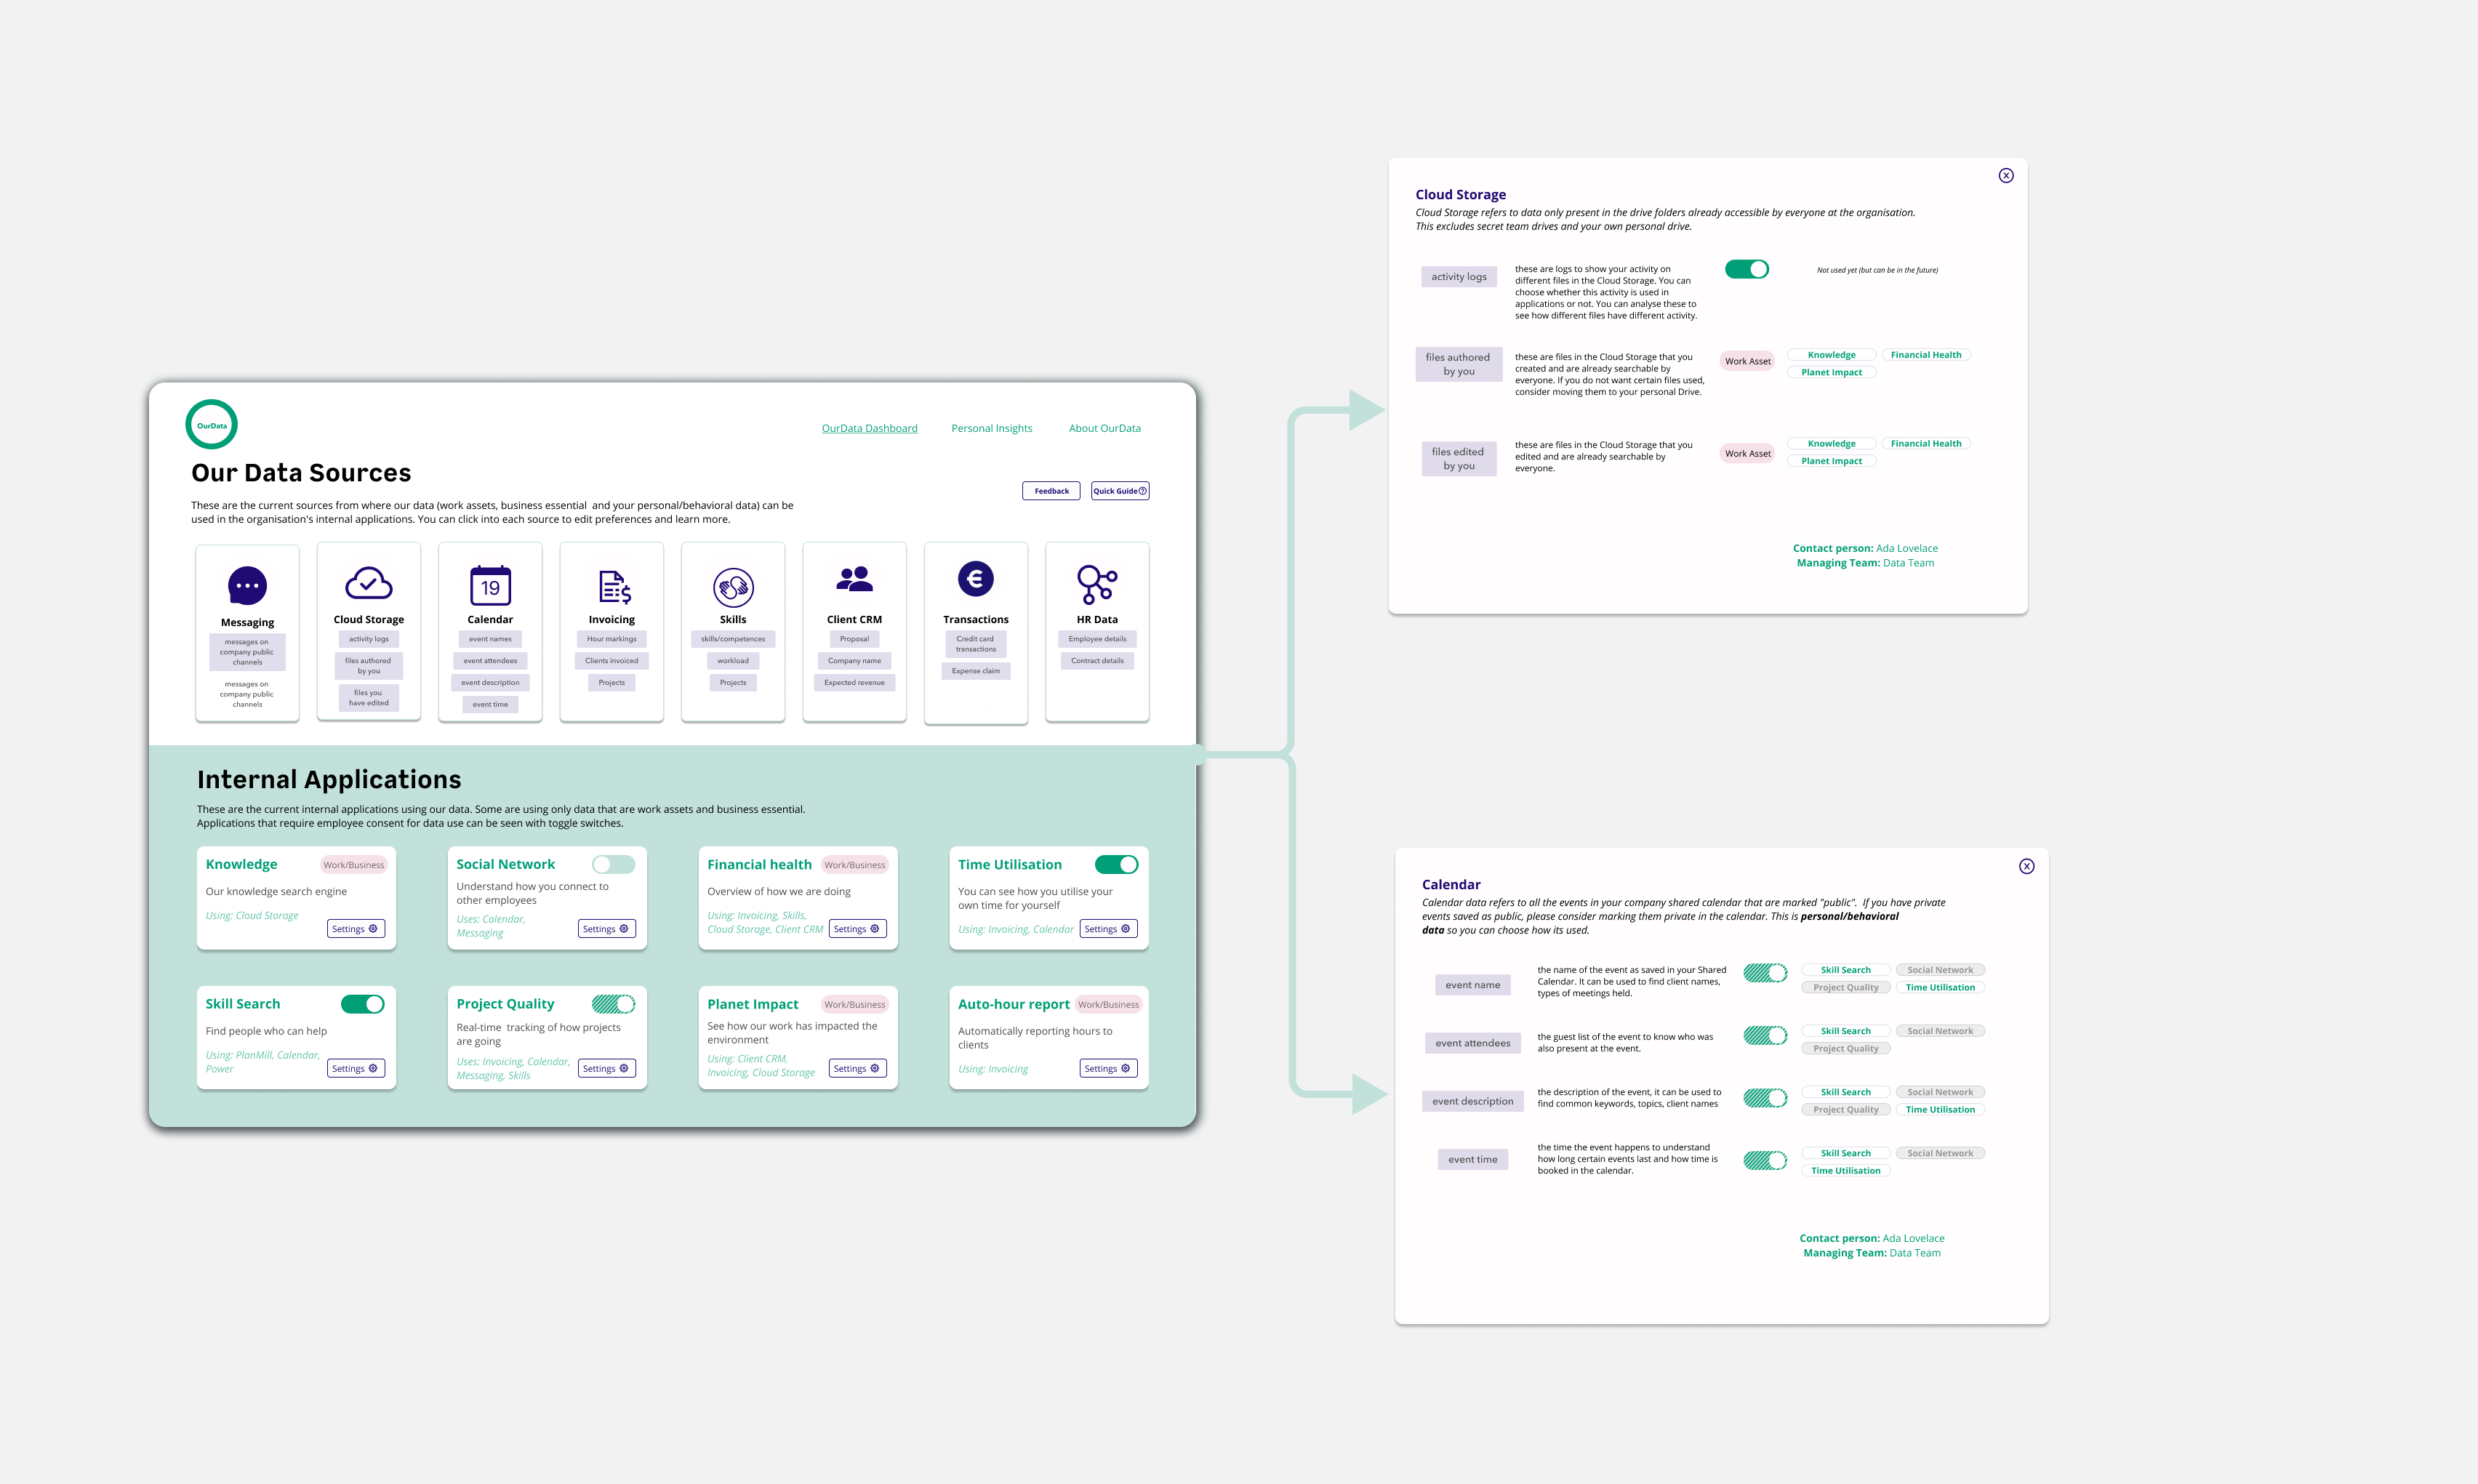
Flows showing the two main aspects of the service – the data sources and the data applications
The Outcome:
Final Thesis Presentaion